This paper is available on arxiv under CC 4.0 license.
Authors:
(1) Muhammed Yusuf Kocyigit, Boston University;
(2) Anietie Andy, University of Pennsylvania;
(3) Derry Wijaya, Boston University.
Table of Links
- Abstract and Intro
- Related Works
- Data
- Method
- Analysis and Results
- Conclusion
- Limitations
- Ethics Statement and References
- Appendix: Toxicity Measurement
- Appendix: Correlation Over Time
- Appendix: Wikidata
- Appendix: Hyperparameter Sensitivity
Analysis and Results
In this section, we present results that are obtained using the group embeddings trained with the details provided in the Method Section. We will go over each method of analysis and results here.
Correlation over Time
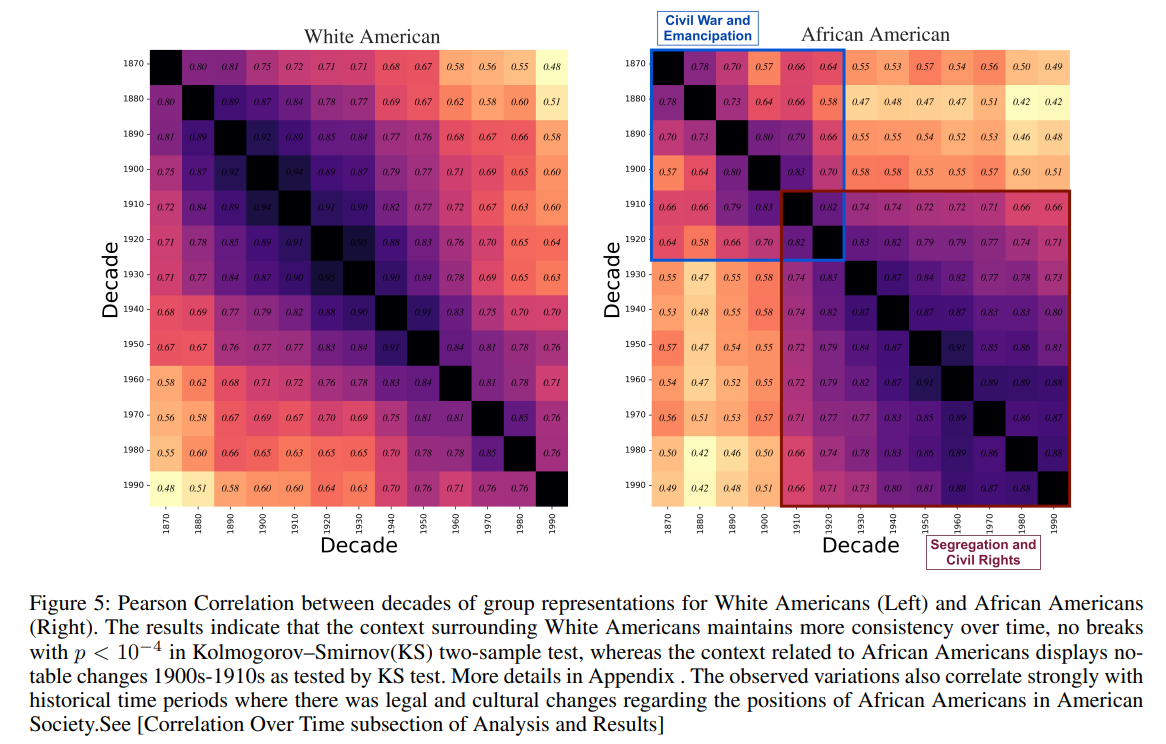
We first examine the temporal relationships within the context of each group. We calculate the Pearson correlation between each pair of decades for every group as illustrated in Figure 5. For example, the top-right cell in Figure 5 would be the Pearson correlation between the vectors for the African American group embeddings for 1870 and 1990.
The objective of this is two-fold. First, we want to see how the context around each racial group has changed, which decades have exhibited stronger changes compared to others. Second, this we use this as a sanity check mechanism similar to Garg et al. (2018).
Our findings suggest that the context encompassing White Americans exhibits greater stability over time with most decades correlating over 0.6 with any other decade. In contrast, the context pertaining to African Americans demonstrates significant discontinuities. This highlights the potential disparities in the evolution of social contexts surrounding these groups throughout history.

Additionally we show that the way African Americans are represented in books has drastically changed at the turn of the 20th century. This change splits the time frame between 1870-1900 and 1900-2000 corresponding to the Civil War and Emancipation and the Segregation and Civil Rights periods (which we have marked over the heatmap) with a certain delay, which we approximate as 10 years. We also test the significance of the observed difference with the Kolmogorov–Smirnov two-sample test (more details in Appendix: Correlation Over Time) and show that there is a notable change in the period between 1900s-1910s in the African Americans embeddings, indicating that the important social events of the time as well as the civil rights movement had a strong impact on the representation of African Americans in books.
Literature is naturally influenced by socio-political events but in this work we computationally measure the rate and extent of this influence and show the details of this change as well. Additionally this analysis serves as a verification of the embeddings. The alignment between the results our method has captured and well known historical events is emblematic of the method’s capacity to effectively capture and illuminate large-scale trends within literary works. Consequently, our method’s ability to reveal outcomes that resonate with our understanding of historical events is a strong signal that the collection of individual representations can be used to measure the representation of the collection of individuals.
Semantic Axes
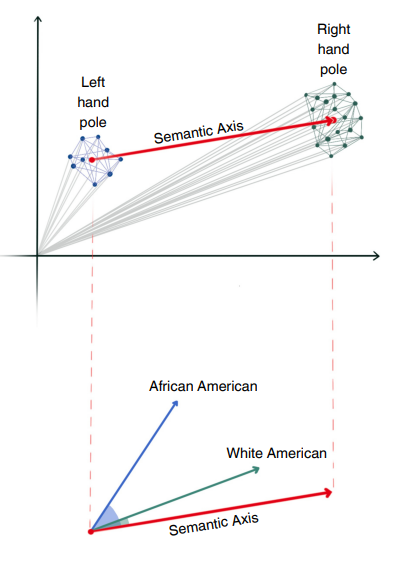
Our second approach to analyzing the context involves the use of semantic axes, as introduced by Lucy, Tadimeti, and Bamman (2022). Semantic Axes, broadly are collections of adjectives that define a specific relationship. For example an axis could be the ”Noble” axis where one (left-hand) pole is defined by words like base, common, and ignoble and the other (right-hand) pole is defined by words like aristocratic, august, and blue. The semantic axis is the vector connecting the mean of the left-hand pole toward the mean of the righthand pole. Later any word vector can be compared to this semantic axis via cosine distance and analyzed in this direction i.e., nobility in this case. We employ the entire collection of 732 semantic axes presented by Lucy, Tadimeti, and Bamman (2022), and represent the poles of these axes with vectors derived from the pre-trained embeddings released by (Hamilton, Leskovec, and Jurafsky 2016). Following Lucy, Tadimeti, and Bamman (2022), we exclude any semantic axis that doesn’t contain at least three words in both poles.
Utilizing the learned group representations, we compute the difference in the cosine similarity between the vector for African American and White American groups to the semantic axes in the same way with An, Kwak, and Ahn (2018). We use the cosine similarity between each group embedding and the semantic vector, then taking the absolute difference between these similarities. In Table 1, we display these results, with each row corresponding to a decade and showcasing the top-2 semantic axes that exhibit the highest absolute difference between the groups in that decade. The pole words exhibiting greater similarity to each group is placed under its respective column.

In Table 1 we observe that the most significant differences between African Americans and White Americans are in semantic axes related to social status. Between 1850- 1990, African Americans were associated with terms such as ”lowly”, ”outlawed” and ”inferior” while White Americans were associated with terms such as ”grand”, ”legal” and ”eminent”. Additionally, if one of the poles of a semantic axis can be identified to have a negative meaning African Americans are consistently related to the negative pole of of that semantic axis with only a few exceptions.
Toxicity
Finally, we investigate the toxicity of the context and how it has evolved over time. To achieve this, we employ a dictionary-based approach using toxic words provided by HurtLex (Bassignana, Basile, and Patti 2018). However, as words can lose or acquire toxic meanings over time; to account for this, we introduce a novel filtering method. First, we identify semantic axes with the highest average cosine similarity between their poles and the list of toxic words for the latest decade for which we have embeddings, 1990-2000. This process yields a set of axes in which toxic words are predominantly clustered around one of the poles. We select the top 10 semantic axes, and for each decade, we recompute the vectors for these axes and the similarity of toxic words to these axes. We assume that the meaning of a word with respect to toxicity has significantly changed if it switches its side (from being closer to one pole to being closer to the opposite pole) in more than half of these semantic axes. This method is effective in eliminating words that might no longer be toxic; however, we do not search the entire vocabulary for additional toxic words. While extending our approach to include this aspect could be beneficial, it constitutes a separate research direction and is beyond the scope of this paper.
![Figure 7: Percentage of Toxic Words for African American and White American figures. We observe that the toxicity for African Americans in books drops after the civil war but rapidly increases after the segregation (1900s) and during the early Civil Rights movement (1950s). While the toxicity has decreased in more recent times, it is still 50% higher compared to White Americans. See [Toxicity subsection of Analysis and Results]](https://cdn.hackernoon.com/images/fWZa4tUiBGemnqQfBGgCPf9594N2-42a3vbx.png)
Our initial hypothesis posited that toxic words would cluster around semantic poles such as ”bad” or ”wrong.” Nonetheless, our experiments revealed that the most extreme poles where toxic words cluster are regular ↔ irregular, educated ↔ ignorant, superior ↔ inferior, and normal ↔ abnormal, with toxic words clustering around the latter in each case. In the Appendix , we provide further details on the filtering of toxic words.
Figure 7 shows that the content in books around African Americans is always more toxic compared to White Americans. While the toxicity has dropped after the Civil War, in 1860s and 1870s, this changes and there is an upsurge in toxicity after the 1900s which marks the beginning of the segregation era and continues increasing to the Civil Rights movement (1950s). Finally, in the most recent decades while toxicity has somewhat decreased, African Americans are still exposed to more toxic words and context.
![Table 1: The top two semantic axes with maximum absolute difference between the two groups per decade. An example read: For 1850, In the semantic axes defined by the adjectives grand ↔ vulgar, White Americans were closer to the pole defined by the adjective “grand” and the difference in cosine similarity to this axis between the two groups was 0.28. Insight: We show that before 1940s African American representation is more frequently closer to negative adjectives signaling a long-lasting bias in representation of African American figures in books. See [Semantic Axes subsection of Analysis and Results]](https://cdn.hackernoon.com/images/fWZa4tUiBGemnqQfBGgCPf9594N2-ztb3v8h.png)
