In the past, when we talked about the backend, we usually referred to one large application with a single, big database, and logging was sufficient for monitoring. Now, thanks to technologies like Kubernetes, microservices have become the standard. Applications are more numerous and distributed, and traditional logging is no longer enough for debugging and diagnosing problems in our applications.
An excellent solution for organizing monitoring is OpenTelemetry — a modern toolkit that can be used for debugging and performance analysis of distributed systems.
This article is intended for IT professionals seeking to expand their knowledge in backend optimization. Below, we will detail what OpenTelemetry is, its key concepts, and the problems it helps solve. If you are interested in how OpenTelemetry can change your approach to monitoring and debugging backend systems, enhancing their reliability and efficiency — read on.
A Brief History of OpenTelemetry
Large tech companies first faced the challenge of distributed logging and tracing in the late 2000s. In 2010, Google published a paper,
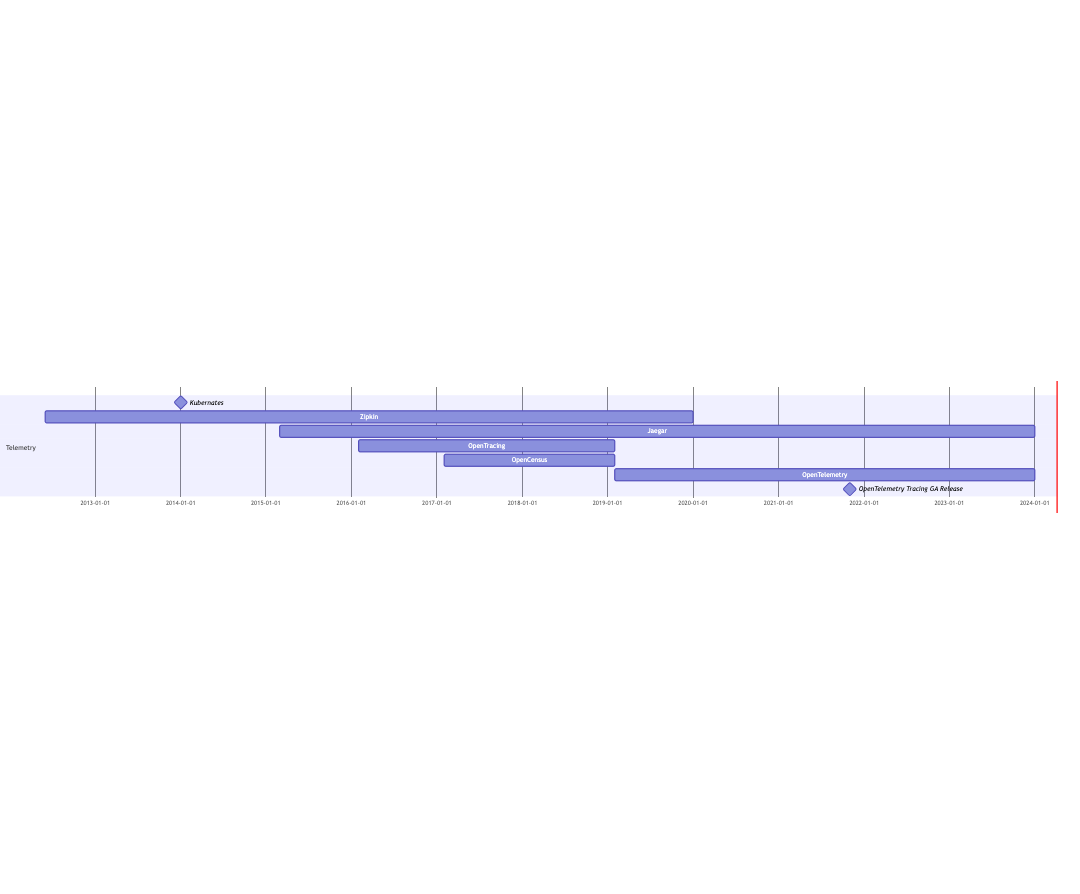
In 2014, Kubernetes emerged, significantly simplifying the development of microservices and other cloud-distributed systems. This led to many companies encountering issues with distributed logging and tracing in microservices. To standardize distributed tracing, the OpenTracing standard, adopted by CNCF, and Google's OpenCensus project was created.
In 2019, the OpenTracing and OpenCensus projects announced a merger under the name OpenTelemetry. This platform combines the best practices accumulated over many years, allowing seamless integration of tracing, logging, and metrics into any system, regardless of their complexity.
Today, OpenTelemetry is not just a project; it is an industry standard for collecting and transmitting telemetry data. It is developed and supported by a community of specialists and market-leading companies like Google and Microsoft. The project continues to evolve, gaining new capabilities to simplify the integration and use process.
What's Inside?
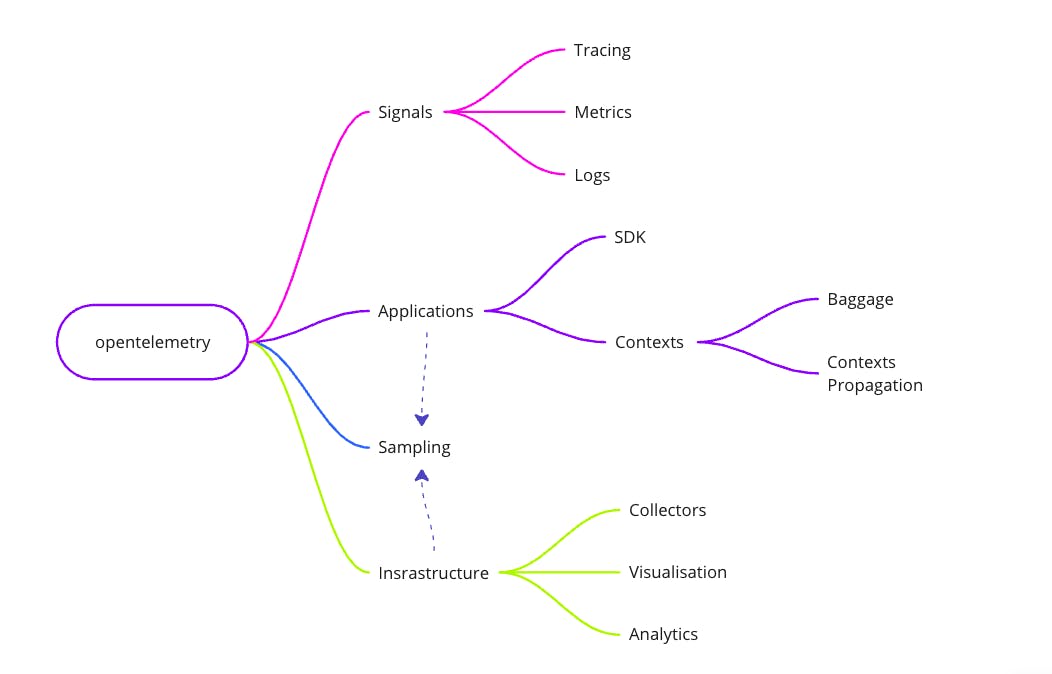
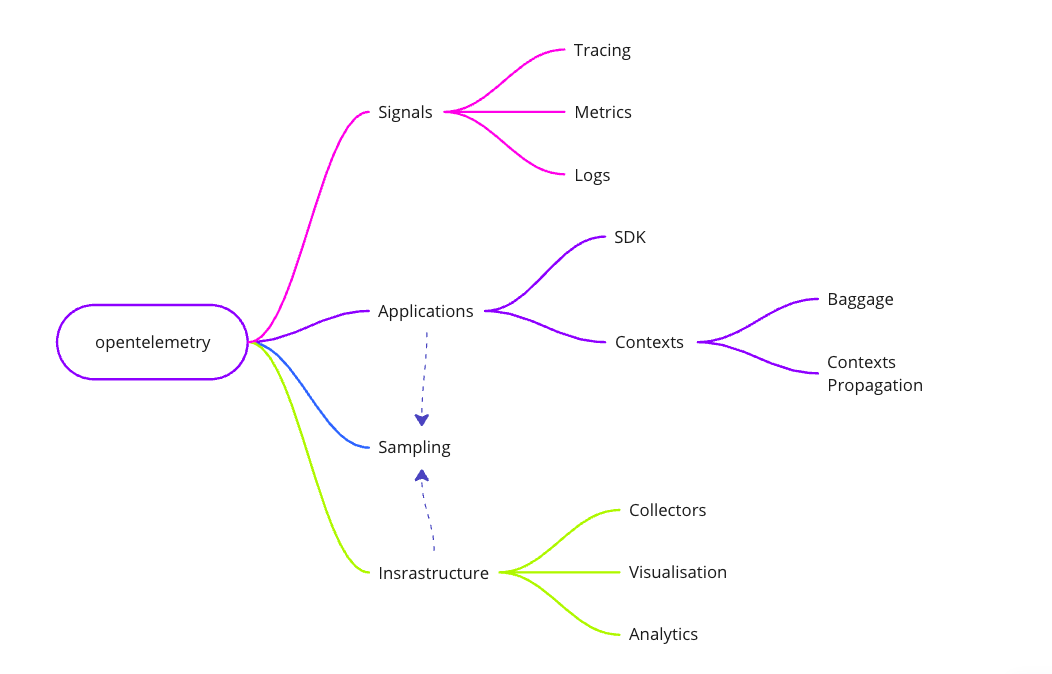
OpenTelemetry is a comprehensive set of practices and tools that define what signals an application can generate to interact with the outside world, and how these signals can be collected and visualised to monitor the state of applications and the system as a whole. The three main types of signals are tracing, logging, and metrics collection.
**Let's take a closer look at each component:
\
Contexts
OpenTelemetry introduces the concept of operation contexts. A context primarily includes attributes such as `trace_id` (identifier for the current operation) and `span_id` (identifier for a sub-request, with each retry of a sub-request having a unique `span_id`).
Additionally, a context can contain static information, such as the node name where the application is deployed or the environment name (prod/qa). These fields, known as resources in OpenTelemetry terminology, are attached to every log, metric, or trace for easier searchability. Contexts can also include dynamic data, like the identifier of the current endpoint (`http_path: "GET /user/:id/info"`), which can be selectively attached to groups of logs, metrics, or traces.
OpenTelemetry contexts can be passed between different applications using context propagation protocols. These protocols consist of header sets that are added to every HTTP or gRPC request or the headers of messages for queues. This allows downstream applications to reconstruct the operation context from these headers.
Here are some examples of context propagation:
-
B3-Propagation This is a set of headers (
x-b3-*) originally developed for the Zipkin tracing system. It was adapted into OpenTracing and used by many tools and libraries. B3-Propagation carriestrace_id/span_idand a flag indicating whether sampling is necessary. -
W3C Trace Context Developed by the W3C working group, this standard unifies various context propagation approaches into a single standard and is the default in OpenTelemetry. A good example of applying these standards is tracking the execution of a request passing through microservices implemented with different technologies without compromising monitoring and debugging accuracy.
Tracing
Tracing is the process of recording and subsequently visualizing the timeline of a request's path through multiple microservices.
In the visualization, each bar is called a "span" and has a unique "span_id". The root span is referred to as a "trace" and has a "trace_id", which serves as the identifier for the entire request.
This type of visualization allows you to:
- Analyze the execution time of requests across different systems and databases to identify bottlenecks that need optimization.
- Detect cyclic dependencies between services.
- Find duplicate requests. Using tracing data, you can also build additional analytics, such as creating a microservices map or distributing time across different systems during operation processing. Even if you don't use trace data to visualize timelines, OpenTelemetry still generates
trace_idandspan_idfor use in other signals.
Logs
Despite its apparent simplicity, logging remains one of the most powerful tools for diagnosing problems. OpenTelemetry enhances traditional logging by adding contextual information. Specifically, if an active trace is present, `trace_id` and `span_id` attributes are automatically added to logs, linking them to the trace timeline. Moreover, log attributes can include static information from the OpenTelemetry context, such as the node identifier, as well as dynamic information, like the current HTTP endpoint identifier (`http_path: "GET /user/:id"`).
Using the `trace_id`, you can find logs from all microservices associated with the current request, while the `span_id` allows you to differentiate between sub-requests. For example, in the case of retries, logs from different attempts will have different `span_id`s. Using these identifiers enables quick analysis of the entire system's behavior in real-time, speeding up problem diagnosis and enhancing stability and reliability.
Metrics
Metrics collection provides quantitative data on system performance, such as latency, error rates, resource usage, and more. Real-time monitoring of metrics allows you to promptly respond to performance changes, prevent failures and resource exhaustion, and ensure high availability and reliability of the application for users.
Integration with metric storage and visualization systems like Prometheus and Grafana makes it easier to visualize this data, significantly simplifying monitoring.
Metric Collectors
OpenTelemetry metric collectors are compatible with Prometheus and OpenMetrics standards, enabling an easy transition to OpenTelemetry solutions without significant changes. The OpenTelemetry SDK allows trace_id examples to be exported along with metrics, making it possible to correlate metrics with log examples and traces.
Signal Correlation
Together, logs, metrics, and tracing create a comprehensive view of the system's state:
- Logs provide information about system events, allowing for quick identification and resolution of errors.
- Metrics reflect qualitative and quantitative performance indicators of the system, such as response times or error rates.
- Tracing complements this view by showing the path of request execution through various system components, helping to understand their interrelationships. The clear correlation between logs, traces, and metrics is a distinctive feature of OpenTelemetry. For instance, Grafana allows users to see the corresponding trace and request metrics when viewing a log, greatly enhancing the platform's usability and efficiency.
In addition to the three core components, OpenTelemetry includes the concepts of Sampling, Baggage, and operation context management.
Sampling
In high-load systems, the volume of logs and traces becomes enormous, requiring substantial resources for infrastructure and data storage. To address this issue, OpenTelemetry standards include signal sampling — the ability to export only a portion of traces and logs. For example, you can export detailed signals from a percentage of requests, long-running requests, or error requests. This approach allows for sufficient sampling to build statistics while saving significant resources.
However, if each system independently decides which requests to monitor in detail, we end up with a fragmented view of each request. Some systems may export detailed data while others may only partially export or not export at all.
To solve this problem, OpenTelemetry's context propagation mechanisms transmit a sampling flag along with the `trace_id`/`span_id`. This ensures that if the initial service receiving the user request decides that the request should be monitored in detail, all other systems will follow suit. Otherwise, all systems should partially or not export signals to conserve resources. This approach is called "Head Sampling" — a decision made at the beginning of request processing, either randomly or based on some input attributes.
Besides, OpenTelemetry supports "Tail Sampling," where all applications always export all signals in detail, but an intermediate buffer exists. After collecting all the data, this buffer decides whether to retain the full data or keep only a partial sample. This method allows for a more representative sample of each request category (successful/long/error) but requires additional infrastructure setup.
Baggage
The Baggage mechanism allows arbitrary key-value pairs to be transmitted along with trace_id/span_id, automatically passing between all microservices during request processing. This is useful for transmitting additional information needed throughout the request path—such as user information or runtime environment settings.
Example of a header for transmitting baggage according to the W3C standard:
tracestate: rojo=00f067aa0ba902b7,congo=t61rcWkgMzE,userId=1c30032v5
Here are some examples of Baggage usage:
-
Passing Business Context Information such as
userId,productId, ordeviceIdcan be passed through all microservices. Applications can automatically log this information, allowing for log searches by user context for the original request. -
Specific Configuration Parameters Settings for SDKs or infrastructure.
-
Routing Flags Flags that help load balancers make routing decisions. During testing, some requests might need to be routed to mock backends. Since baggage is transmitted automatically through all services, there's no need to create additional protocols—just set up a rule on the load balancer.
Note that while the performance impact of Baggage is minimal, excessive use can significantly increase network and service load. Carefully choose which data you really need to pass through Baggage to avoid performance issues.
Infrastructure Implementation
Implementing OpenTelemetry at the infrastructure level involves integrating OpenTelemetry backends into the application architecture and configuring the infrastructure for data aggregation.
The process consists of four stages:
-
Application Integration In the first stage, OpenTelemetry SDKs are directly integrated into applications to collect metrics, logs, and traces, ensuring a continuous flow of data about each system component's performance.
-
Configuring Exporters Collected data is routed from applications through exporters to external systems for further processing, such as logging, monitoring, tracing, or analytics systems, depending on your needs.
-
Aggregation and Storage This stage may involve normalizing data, enriching it with additional information, and merging data from different sources to create a unified view of the system's state.
-
Data Visualization Finally, processed data is presented as dashboards in systems like Grafana (for metrics and traces) or Kibana (for logs). This allows teams to quickly assess the system's health, identify issues and trends, and set up alerts based on generated signals.
Application Implementation
To integrate with an application, you need to connect the appropriate OpenTelemetry SDK for the programming language in use or employ libraries and frameworks that directly support OpenTelemetry. OpenTelemetry often implements widely used interfaces from known libraries, allowing drop-in replacements. For example, the Micrometer library is commonly used for metrics collection in the Java ecosystem. The OpenTelemetry SDK provides its implementations of Micrometer interfaces, enabling metric export without changing the main application code. Moreover, OpenTelemetry offers implementations of older OpenTracing and OpenCensus interfaces, facilitating a smooth migration to OpenTelemetry.
Conclusion
In IT systems, OpenTelemetry can become the key to the future of reliable and efficient backends. This tool simplifies debugging and monitoring and also opens up opportunities for a deep understanding of application performance and optimization at a new level. Join the OpenTelemetry community to help shape a future where backend development is simpler and more effective!


