Authors:
(1) Vasiliki Kougia, University of Vienna, Faculty of computer science, Vienna, Austria & UniVie Doctoral School Computer Science, Vienna, Austria;
(2) Simon Fetze, University of Vienna, Faculty of computer science, Vienna, Austria;
(3) Thomas Kirchmair, University of Vienna, Faculty of computer science, Vienna, Austria;
(4) Erion Çano, University of Vienna, Faculty of computer science, Vienna, Austria;
(5) Sina Moayed Baharlou, Boston University, Department of Electrical and Computer Engineering, Boston, MA, USA;
(6) Sahand Sharifzadeh, Ludwig Maximilians University of Munich, Faculty of Computer Science, Munich, Germany;
(7) Benjamin Roth, University of Vienna, Faculty of computer science, Vienna, Austria.
Table of Links
Conclusion, Acknowledgments, and References
3 MemeGraphs
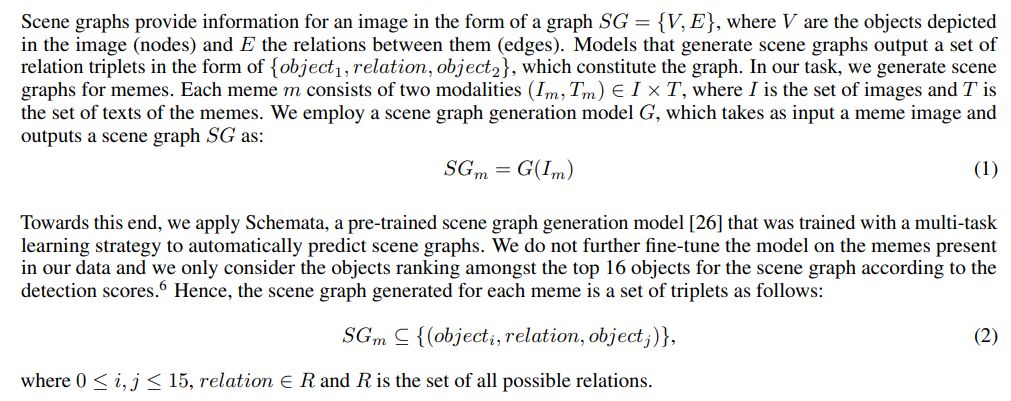
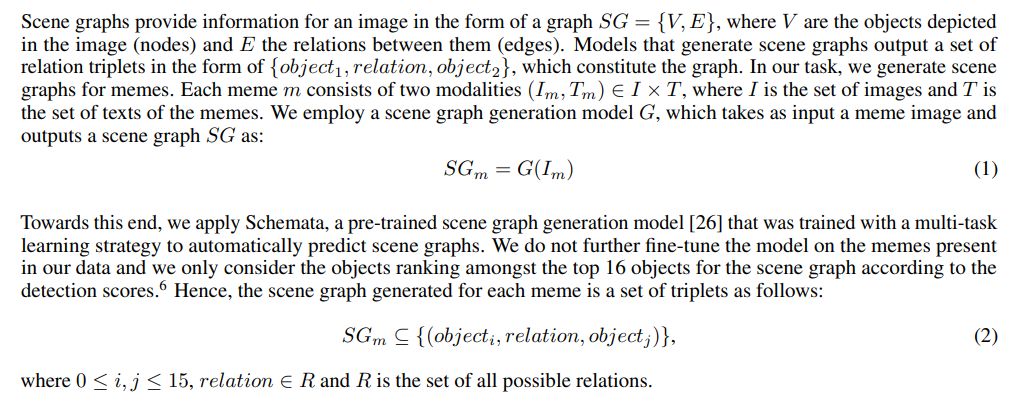
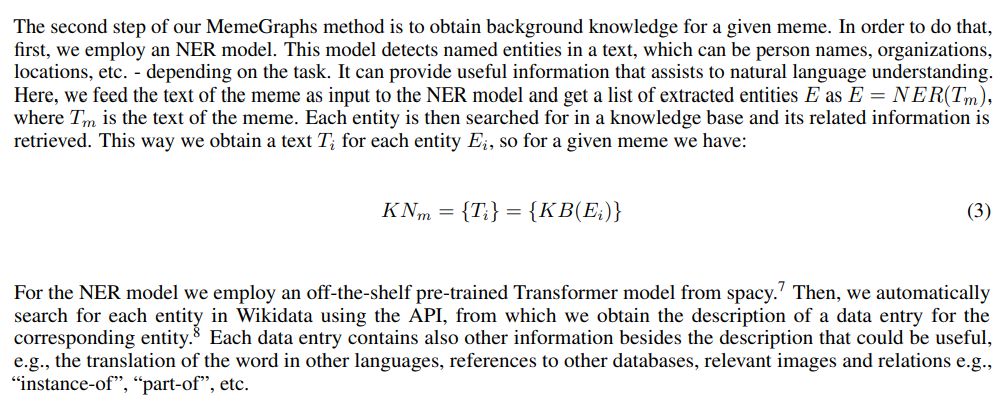
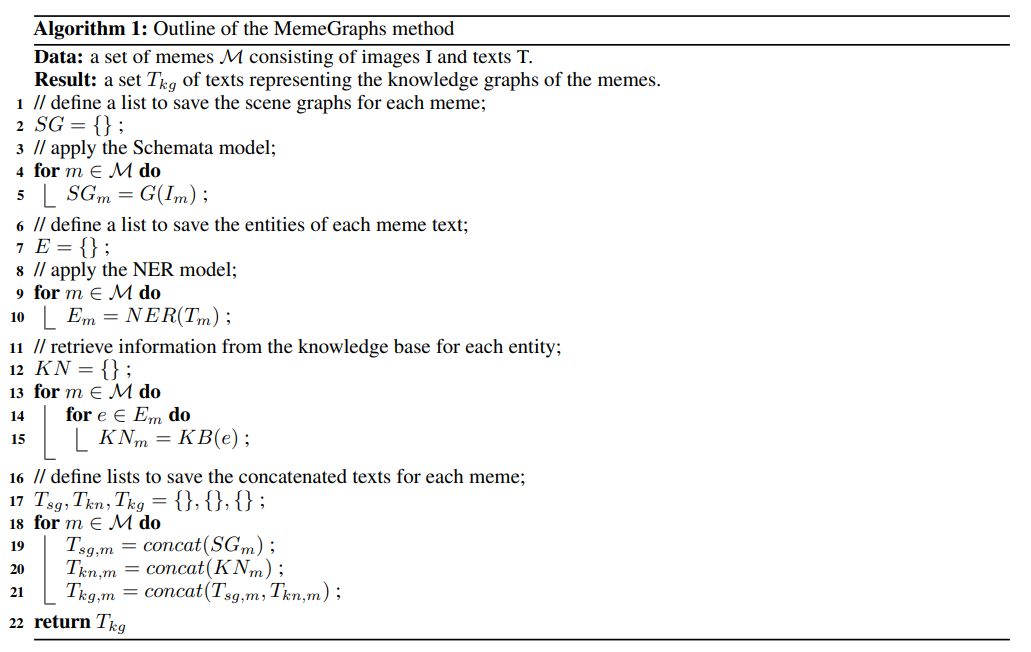
In this section, we describe our method for automatic augmentation of a memes dataset, an approach we call MemeGraphs. Our proposed method consists of three steps: 1. Scene graph construction, 2. Knowledge linking to detected entities and 3. The construction of the final MemeGraphs input. The first two steps are performed automatically by using off-the-shelf models. Hence, the result of MemeGraphs are knowledge graphs representing the meme as a whole, which can be used to classify them, e.g., for hate detection. We build on the MultiOFF dataset, which contains memes extracted from social media during the 2016 U.S. Presidential Election [28]. In what follows, we present the three individual steps of MemeGraphs in detail and how the final result is constructed.
3.1 Scene graphs
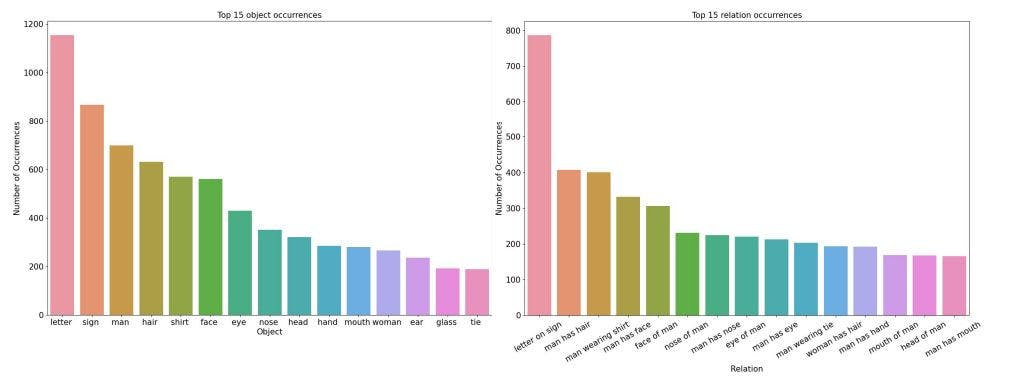
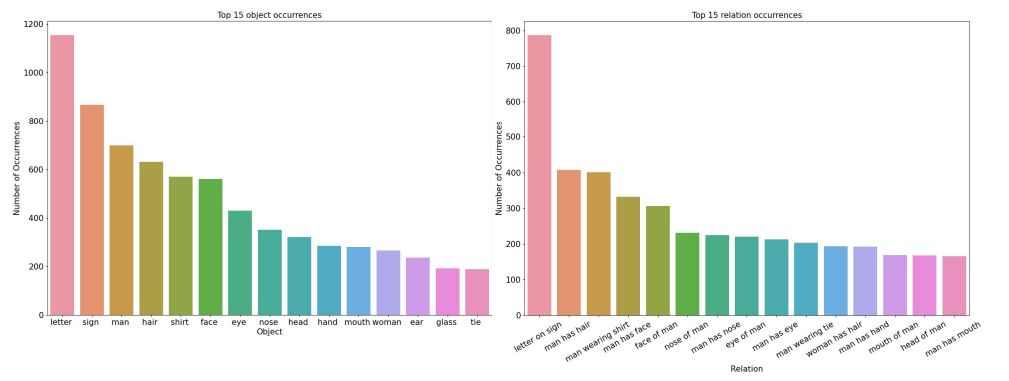
For 67 memes, Schemata did not produce any output. For the remaining 676 memes, 10,426 relations and 9,666 objects were detected in total. The number of unique objects and relations was 142 and 970 respectively. And while the number of objects detected in an image ranged from 2 to 16, the number of detected relations ranged from 1 to 40. The top 15 most frequently detected object and relation types are shown in Fig. 2.
3.2 Knowledge linking
3.3 Knowledge graph input

[6] This number was chosen after observation of the scene graphs resulting from the memes in order to avoid having an overcrowded scene graph with multiple objects.
[7] https://spacy.io/universe/project/spacy-transformers
[8] https://www.wikidata.org/wiki/Wikidata:Main_Page
[9] All the texts are concatenated with a full stop.
This paper is available on arxiv under CC 4.0 license.
