Authors:
(1) Vasiliki Kougia, University of Vienna, Faculty of computer science, Vienna, Austria & UniVie Doctoral School Computer Science, Vienna, Austria;
(2) Simon Fetze, University of Vienna, Faculty of computer science, Vienna, Austria;
(3) Thomas Kirchmair, University of Vienna, Faculty of computer science, Vienna, Austria;
(4) Erion Çano, University of Vienna, Faculty of computer science, Vienna, Austria;
(5) Sina Moayed Baharlou, Boston University, Department of Electrical and Computer Engineering, Boston, MA, USA;
(6) Sahand Sharifzadeh, Ludwig Maximilians University of Munich, Faculty of Computer Science, Munich, Germany;
(7) Benjamin Roth, University of Vienna, Faculty of computer science, Vienna, Austria.
Table of Links
Conclusion, Acknowledgments, and References
4 Benchmarking
4.1 Models
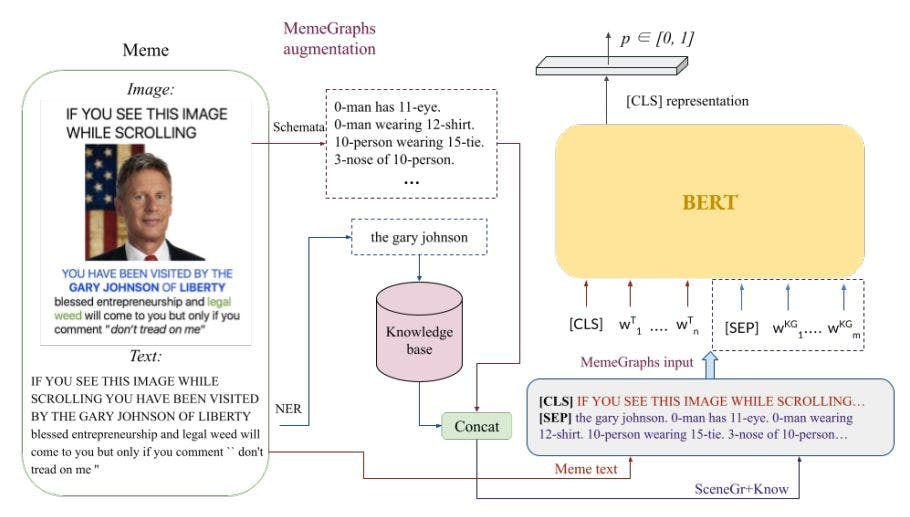
To evaluate the results of our automatic augmentation and how it can affect the performance of hateful memes classification, we employed a text-based Transformer with and without the MemeGraphs information as well as a multimodal model. Previous work has shown that using only the text of the memes for classification gives results highly competitive with multimodal methods [14, 13, 28]. On the other hand, unimodal image-based models have lowest results. We use a pre-trained BERT [9] model that takes as input the text of each meme (TxtBERT) [14] and different variants of this approach that include the MemeGraphs input. In order to feed the graphs as input to the model, we represent them as a text sequence (see Section 3), which is given as an extra text input after the [SEP] token (Fig. 3). In the model that we call MemeGraphs[SceneGr], this sequence contained only the scene graphs, which were represented by triplets of the detected objects and the relations between them (Eq. 2), e.g., “0-man has 11-eye. 0-man wearing 12-shirt.”. In the model called MemeGraphs[Know], the text descriptions from the knowledge base corresponding to the detected entities are added as extra input (Eq. 3). For example, the second input sequence for the meme shown in Figure 3 will be “American politician, businessman, and 29th Governor of New Mexico.”. While in the MemeGraphs[SceneGr+Know] model, information from the whole knowledge graphs is added, comprising the scene graphs and the background knowledge concatenated with a full stop into one sequence (see Subsection 3.3). In all the models, the [CLS] token is fed into a final linear layer with a sigmoid activation function that produced the probability of the meme being hateful.
In order to compare our MemeGraphs approach with a method that employs learned visual representations, we use ImgBERT, an early fusion multimodal model (see Section 2).
4.2 Experimental Setup
Each meme was labeled in the original dataset as offensive or non-offensive. The classification was based on the offensiveness labels that exist in the MultiOFF dataset. The dataset is slightly imbalanced with 42% of the samples being offensive. For training and testing the models, we used the split provided by the authors of the dataset. The split consisted of training, validation, and test sets, which contained 445, 149, and 149 memes respectively. We employed the pre-trained BERT model provided by Hugging Face and fine-tuned it on our dataset.[10] To obtain image embeddings, we experimented with several pre-trained CNN models and based on the best results we chose DenseNet with 161 layers. The embeddings were extracted from the last pooling layer. The max length was set as the average token length of the training texts, depending on the input of each model. The models were trained using batch size 16, the weighted binary cross entropy loss, and AdamW optimizer with an initial learning rate of 2e-5. We used early stopping based on the validation loss with a patience of 3 epochs. We trained all models 20 times with different seeds and the training lasted between 4 and 6 epochs in each run. During inference, a threshold was used to determine if a meme is hateful or not based on the produced probability. This threshold was set to 0.5 for all the models.
![Figure 3: The architecture of MemeGraphs[SceneGr+Know]. The scene graph produced by the Schemata model and the background knowledge for each entity are concatenated and given as input to BERT after the text of the meme and the [SEP] token.](https://cdn.hackernoon.com/images/fWZa4tUiBGemnqQfBGgCPf9594N2-3a83vfs.jpeg)
4.3 Benchmarking results
For each model, we obtained predictions for the test set from all twenty differently initialized runs. We evaluated each prediction set by calculating the F1 score defining the minority class (offensive class) as positive. In Table 1, we report the average F1 score over the twenty runs for each method and the corresponding standard error. In Table 2, the test score of the model that achieved the best score on the development set is shown. We observe that MemeGraphs[SceneGr+Know] outperforms the other models when predicting with the best checkpoint (Table 2). On the other hand, when looking at the average, the model with only the background knowledge as input achieves the best F1 score (MemeGraphs[Know]). We generally observe that the methods that incorporate our automatic augmentation (MemeGraphs) outperform the simple text-based fine-tuned BERT. Also, ImgBERT is outperformed showing that when the visual information is employed in the form of scene graphs the performance is improved, compared to when using only the image embeddings.


[10] https://huggingface.co/docs/transformers/model_doc/bert#transformers.BertForSequenceClassification
This paper is available on arxiv under CC 4.0 license.

